Visualize Multiple MapIt Areas
It is sometimes useful to be able to see all areas of a particular type rendered onto a map, for example to check that the coverage of a region is complete. MapIt doesn’t provide this functionality itself, but there is a Django admin command you can use to generate a file that can be visualized in Google Fusion Tables.
Here are a couple of example invocations of the script.
e.g. 1: in MapIt Global, find all countries:
./manage.py mapit_make_fusion_csv --type=O02 \
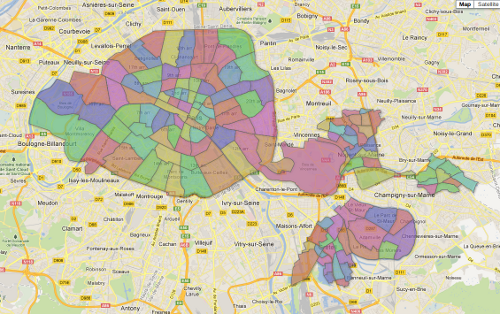
--tolerance=0.001 global-countries.csve.g. 2: in MapIt Global, find all admin_level="10" areas in France:
./manage.py mapit_make_fusion_csv --types=O10 \
    --coveredby=28 france-10.csv
(That assumes that 28 is the ID of the area corresponding to France in your MapIt.)
To import such CSV files into Google Fusion Tables, and make them look good, do the following:
-
Go to Google Fusion Tables and click “Create a new table”
-
Select the CSV file you generated, with the defaults (“comma” as the separator and UTF-8 encoding). Then click “Next”.
-
In the next dialog, the default (“Column names are in row 1”) should be fine, so just click “Next”
-
Put the correct attribution in the “Attribute data to” and the “Attribution page link” fields (e.g. “OpenStreetMap contributors and MapIt Global” and “http://global.mapit.mysociety.org/”). Then click “Finish”.
-
Now click on the “Map of name” tab. Select “location” from the
Tools -> Select locationsubmenu. -
Go to
Tools -> Change map style ..., selectPolygons -> Fill color, the Column tab, and specify the “color” column for colours. -
You might need to switch to the “Rows 1” tab and back to the “Map of name” tab for the areas to be visible.
-
Go to
File -> Shareand change “Private” to “Anyone with the link”